Monitor Tools
Fsmond command is used to monitor thread's running status and memory of Flow Service in real time.
In addition, user can confirm the statistical graph of Flow Engine kept in Flow Service by management console. User can specify and show the date or statistical period in the graph.
GUI Version
In the environment of Windows system or UNIX's X Windows system, Flow Service's running status can be checked by graph. Because in these systems there are execution files as below, the commands can be executed from command lines.
| UNIX | [INSTALL_DIR]/flow/bin/fsmon |
| Windows | [INSTALL_DIR]/flow/bin/fsmon.exe |
Once command runs, the window as below will be shown.
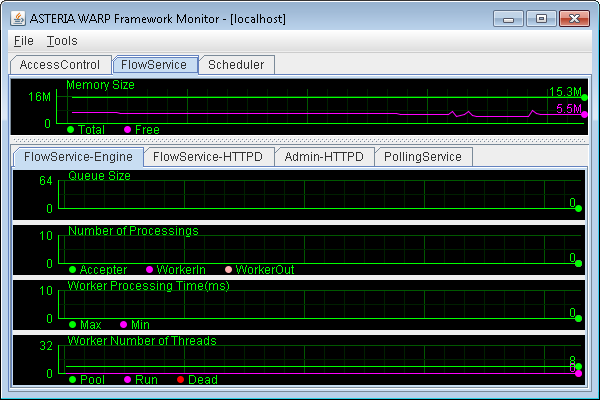
Each item of the graph is as below.
| Memory Size |
It shows the amount of memory being used by Flow Service processes. It's the amount that can be seen from Java program, so it's different from the one can be seen from OS.
|
||||||
| Queue Size | It shows the number of requests accumulated in the queue. We can know that it's difficult for a Worker to process the requests accumulated in large amount from it. For the case, it's necessary to discuss about the system instructure including thread number increasing and system strengthening etc. | ||||||
| Process Number |
It shows the number of requests that have been processed in per unit of time.
|
||||||
| Process time of Worker | It shows the average time spent in processing one request. | ||||||
| Thread number of Worker |
It shows the status of Worker threads which process requests actually.
|
Console Version
In UNIX environment in which GUI can't be shown, console version can be used by running the command as below.
$ fsmon -console
ASTERIA WARP Framework Monitor ${build.number}
Copyright (C) 2002-2011 Infoteria Corporation
All rights reserved.

##2007-05-28T12:17:24.306 JST##
         NAME          TOTL FREE QUEU RACC RWIN RWOT PMAX PMIN WPOL WRUN WDED
[AccessControl       ]   5M   2M
<                SOAP>              0    0    0    0    0    0    1    0    0
<              Engine>              0    0    0    0    0    0    1    0    0
[FlowService         ]   9M   1M
<  FlowService-Engine>              0    0    0    0    0    0    8    0    0
<   FlowService-HTTPD>              0    0    0    0    0    0    8    0    0
<         Admin-HTTPD>              0    0    0    0    0    0    8    0    0
<      PollingService>              0    0    0    0    0    0    4    0    0
[Scheduler           ]   5M   3M
<                SOAP>              0    0    0    0    0    0    1    0    0
<              Engine>              0    0    0    0    0    0    1    0    0
|
Each item is as below.
| TOTL | The total amount of memory available. |
| FREE | The part of the total which is not in use. |
| QUEU | The number of the requets which accummulate in the queue. |
| RACC | The number of the requests accepted. |
| RWIN | The number of the requsets which has begun to be processed by processing thread. |
| RWOT | The number of the requests which has been processed successfully by processing thread. |
| PMAX | The maximum time spent in processing request by procssing thread. |
| PMIN | The minimun time spent in processing requests by processing thread. |
| WPOL | The number of thread pools for processing thread. |
| WRUN | The number of processing threads running. |
| WDED | The number of the threads which have spent much time in processing and are considered as "time out" . ※If the threads have processed successfully and ended in a common way, the number will decrease. |
Option
Fsmon options are as below.
| Functions | Menu for GUI Version | Option for Console Version |
|---|---|---|
| Start console mode. | - | -console |
| Specify a shown process. | "Tools"-"Log Process" | -process Example:-process:FlowService |
| Specify a shown interval in per second. (If the interval isn't specified, it will be set as 2 seconds.) |
"Tools"-"Interval Setting" | -interval Example:-interval:1 |
| Output logs into files | "Tools"-"Log record" | -log Example:-log:filename ※The path is relative to [INSTALL_DIR]/flow, if you specify it by relative path. |
| Selece contens to output them into files. | "Tools"-"Log Contents" | × |
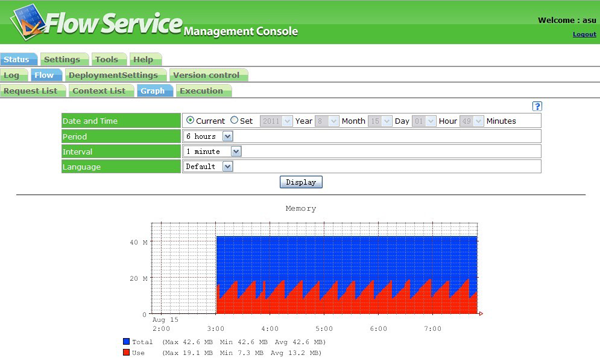
Management Console
From "Status"-"Flow"-"Graoh" window, the information in Flow engine can be shown graphically. Because the statistical information is kept in Flow Service, user can specify and show the date and period by graph. Each item of graph is as same as fsmon command. Please refer to the Item List in above.