See Execution History
Click the right menu "Execution history monitor" of "Monitor" tab,you can see execution history of each pipeline on displayed screen.
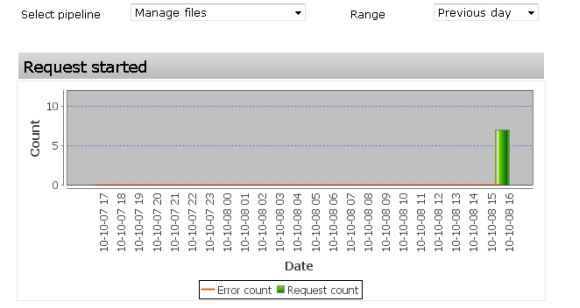
Display of graph settings
| Select pipeline | Select pipeline to display. |
|---|---|
| Graph type | Select time range of graph to display.
|
About graph
| Starting request history | Number of graph that request of pipeline object is started. |
|---|---|
| Completion request history | Number of graph that request of pipeline object is completed. |
| Queue history | Queue history of graph.
|
|---|