Monitoring Tools
The fsmon tool enables you to use real-time graphs to monitor threads' running statuses and the Flow Service's memory use. See the following sections for the metrics the graphs present. Here you can also find guidelines for using the metrics to manage threads.
On the Status > Flow > Graph page in the management console, you can additionally get historical data and filter by a date and time range. See the online help for guides to filtering flow engine metrics.
GUI Version
The fsmon tool provides a graphical version for Windows and for UNIX systems that use X Windows. You can use the graph to monitor threads' running status and the Flow Service's memory use in real time.
To open the fsmon tool on your system, run:
| UNIX | [INSTALL_DIR]/server/bin/fsmon |
|---|---|
| Windows | [INSTALL_DIR]/server/bin/fsmon.exe |
You can select the tabs for server-side services to show the graphs:
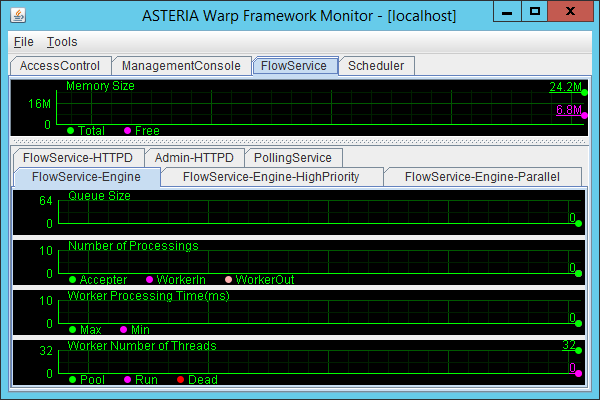
The following table describes the information the graph displays:
| Memory Size | The memory loads seen by the process you select. Note that this is the memory usage seen by the Java program - not the memory usage seen from the OS.
|
||||||
|---|---|---|---|---|---|---|---|
| Queue Size | The number of the requests that are waiting for processing. | ||||||
| Number of Processings | The number of requests in each of the following stages of processing:
|
||||||
| Worker Processing Time | The min and max times spent on processing one request in milliseconds. | ||||||
| Worker Threads | The number of worker threads with the following statuses:
|
Console Version
In a headless UNIX environment, run the console version using the following command:
$ fsmon -console
ASTERIA Warp Framework Monitor 2012.0950
Copyright (C) 2002-2020 Asteria Corporation
All rights reserved.

##2020-02-20T20:20:20.202 JST##
         NAME          TOTL FREE QUEU RACC RWIN RWOT PMAX PMIN WPOL WRUN WDED
[AccessControl       ] 128M 122M
<                SOAP>              0    0    0    0    0    0    1    0    0
<              Engine>              0    0    0    0    0    0    1    0    0
[ManagementConsole   ] 128M 113M
<            MC-HTTPD>              0    0    0    0    0    0    8    0    0
[FlowService         ]   1G 888M
<  FlowService-Engine>              0    0    0    0    0    0   32    0    0
<FlowService-Engine-HighPriority>   0    0    0    0    0    0   32    0    0
<FlowService-Engine-Parallel>       0    0    0    0    0    0   32    0    0
<   FlowService-HTTPD>              0    0    0    0    0    0    8    0    0
<         Admin-HTTPD>              0    0    0    0    0    0    8    0    0
<      PollingService>              0    0    0    0    0    0    4    0    0
[Scheduler           ]  128M 98M
<                SOAP>              0    0    0    0    0    0    1    0    0
< Engine> 0 0 0 0 0 0 1 0 0 |
The table contains the following process details:
| TOTL | The total memory available. |
|---|---|
| FREE | The unused part of the total memory. |
| QUEU | The number of requests waiting for processing. |
| RACC | The number of requests accepted. |
| RWIN | The number of threads that have started processing requests. |
| RWOT | The number of threads that have completed processing requests. |
| PMAX | The maximum time spent on processing one request, in milliseconds. |
| PMIN | The minimum time spent on processing one request, in milliseconds. |
| WPOL | The number of threads waiting for a request to come. |
| WRUN | The number of running threads in the process. |
| WDED | The number of threads that failed to complete processing within the configured timeout. If a thread completes processing and ends successfully, this value decreases. |
Managing Threads
See below for more details on how to use the fields:
Managing Dead Threads
After the request finishes, a thread with a dead status is discarded. If a request doesn't finish, the dead thread decreases the number of active threads in the pool. For example, if there's one dead thread, there can be 31 active threads in the pool, by default. In the case that flow processing time is longer than the timeout value, measure the processing time of the flow, then set the timeout value to be longer than the flow's processing time. Or, increase the CPU performance to decrease the flow's processing time.
Take care that the dead thread count doesn't reach the max thread count -- in this scenario, the Flow Service seems to have stopped.
Managing the Queue Size
If the queue size is high, the backlog of requests signals that there's too much load on the worker threads. Consider increasing the thread number or increasing the CPU.
Options
You can specify the following options:
| Function | Menu Option in the GUI | Command-Line Option |
|---|---|---|
| Start in console mode. | None. | -console |
| Specify a process to filter the output. | Tools > Log Process | -process For example: -process:FlowService You can specify multiple processes in a colon-separated list. |
| Specify the update interval, in seconds. The default interval is 2 seconds. |
Tools > Interval Setting | -interval For example: -interval:1 |
| Output to a log file | Tools > Log Record | -log For example: -log:filename Note that the path is relative to [INSTALL_DIR]/server, if you specify a relative path. |
| Select the fields to output to the log file. | Tools > Log Contents | None. |