 MultiBarGraph - Generates a multi bar chart (PNG)
Generates a multi bar chart image of the PNG format based on input data.
For the flow example that uses this component, please refer to "Example of flow using various chart components".
This component uses BFO library.
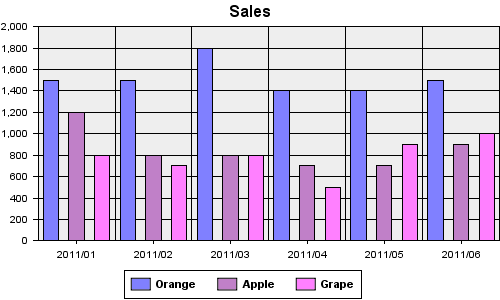
Chart sample
Stream Information
| Input | Format | Record |
|---|---|---|
| Number of Inputs | 1 | |
| Description | Field is pre-defined for this chart. This is read-only. For definitions, please refer to following topic "Input stream definition". | |
| Output | Format | Binary |
| Description | Outputs the chart image of the PNG format. |
Output Stream Variables
| Name | Data Type | Description |
|---|---|---|
| AreaTags | String | Clickable map information of generated chart. Please refer to following topic "Stream variable AreaTags". |
Component Properties
| Name | Data Type | Mapping | Description | |||||||||||||||
|---|---|---|---|---|---|---|---|---|---|---|---|---|---|---|---|---|---|---|
| Width | int | In & Out | Specifies the width of chart image by pixel. | |||||||||||||||
| Height | int | In & Out | Specifies the height of chart image by pixel. | |||||||||||||||
| Title | string | In & Out | Specifies the label of top of the chart. | |||||||||||||||
| Key | choice | In & Out |
Specifies the position to display item names.
|
|||||||||||||||
| Rotate | boolean | In & Out |
Specifies whether to make the graph transverse.
|
|||||||||||||||
| BarWidth | int | In & Out |
Specifies the thickness of the bar by percentage. When omitted, it becomes 60%. |
|||||||||||||||
| OtherPercent | decimal | In & Out |
Specifies the ratio of items "Others". For example, when it's set to "1.0", the item whose ratio of total is less than 1% is brought together in "Others". |
|||||||||||||||
| 3D | boolean | In & Out |
Specifies if enables chart 3D.
|
|||||||||||||||
| LabelRotate | int | In & Out |
Specifies the inclination of the label of the chart. If specifies "-20", The label becomes a right shoulder going up. To display the label vertically, specifies like "90" or "-90" |
|||||||||||||||
| AxisSetting | group | - | Properties for specifies axis information. | |||||||||||||||
| LeftMin | int | In & Out | Specifies minimum of axis Y. | |||||||||||||||
| LeftMax | int | In & Out | Specifies maximum of axis Y. | |||||||||||||||
| LeftLabel | string | In & Out | Specifies label of axis Y. | |||||||||||||||
| BottomLabel | string | In & Out | Specifies label of axis X. | |||||||||||||||
| BackwallPaint | choice | In & Out |
Specifies a background of the chart.
|
|||||||||||||||
| Standard Colors | string | In & Out |
Specifies colors or patterns to use in a chart. 36 of deefault colors are defined. These are used periodically. When clicking the field, the "Select default colors" dialog is displayed. Click the color, edit it, click the "Set" button, then the color is changed. |
Transaction
| Commit | Do nothing |
|---|---|
| Rollback | Do nothing |
Exceptions
| Type | Parameter | Stream for error handling flow | Error Code | Description |
|---|---|---|---|---|
| Exception | None | This component's input stream | - | When failed to generate a chart |
| RecordNotFoundException | None | This component's input stream | 2 | When no record is input |
Input stream definition
Input stream of this component is defined as follows.
| Field Name | Type | Required | Description |
|---|---|---|---|
| BarName | String | Yes | Group name. |
| Key | String | Yes | Item name. |
| Value | Decimal | Yes | Item value. |
| Color | String | No | Bar color. If specified, use specified color instead of the color specified by Colors . |
| Title | String | No | Title displayed when put mouse over the item. If specified, outputs the stream variable AreaTags with the value in area tag. |
| HREF | String | No | URL of the page linked with the chart item If specified, outputs the stream variable AreaTags with the value in area tag. |
| Target | String | No | The target attribute of the link specified by HREF field. If specified, outputs the stream variable AreaTags with the value in area tag. |
Stream variable AreaTags
It is possible to make the generated chart to "clickable map", which is possible to jump to another web sites by the clicked position in the chart.
When the value is set to Title, HREF, and Target field by the input stream definition, the area tag of clickable map information when the chart is referred by a web browser is set to stream variable AreaTags. If img and map are used together with the area tag in HTML that uses Velocity to refer to the chart by a web browser, it is possible to display a title by pointing mouse or to jump by clicking some area.
In addition, operation can be changed as JavaScript is executed when clicking by replacing with the Graph component and customizing it.
For details, please refer to Graph component's help.
Replacing component
This component can be replaced with the following components. Click "Replacing component" of the menu when right-clicking the compoent.
StackedBarGraph component
Generates a stacked bar chart. The input stream is the same. It can be replaced each other.
Graph component
If you want to customize a chart more, you can customize further details by replacing with Graph component.
You can customize chart more by modifying the template in Graph component.
For details, please refer to Graph component's help
After replacing with Graph component, you can not replace it with this component again.