 Graph - Generates chart image (PNG)
Generates chart image of the PNG format based on input data.
For the flow example that uses this component, please refer to "Example of flow using various chart components".
This component uses BFO library. In BFO, the information and data to generate a chart image need to be written in XML format. This component uses Velocity template for creating XML data.
Typically, you should use each specific component to generate Pie chart or Bar chart. If you want ot customize more, use this component by replacing it. When replacing the other component to this, Template property is generated automatically. For templates, please refer to following topic "Template Format"
Individual chart components are as follows. For details, please refer to each component help.
Pie Chart / Bar Chart / Stacked Bar Chart / Multi Bar Chart / Line Chart / Area Chart /
 Scatter Chart / Bubble Chart / Gantt Chart
Stream Information
| Input | Format | Record |
|---|---|---|
| Number of Inputs | 1 | |
| Description |
It is necessary to edit the field according to the kind of the chart to be made. Please refer to help of each chart component. It becomes the same input stream definition when replacing it from the individual graph component. |
|
| Output | Format | Binary |
| Description | Outputs the chart image of the PNG format. |
Output Stream Variables
| Name | Data Type | Description |
|---|---|---|
| AreaTags | String | Clickable map information of generated chart. Please refer to following topic "Stream variable AreaTags". |
Component Properties
| Name | Data Type | Mapping | Description | ||||||
|---|---|---|---|---|---|---|---|---|---|
| TemplateType | choice | - |
Spelects whether the template is specified with the file or it inputs directly. The properties displaying are changed by this property's value.
|
||||||
| OutputFile | boolean | - |
Specifies if saves a generated chart as a file.
|
||||||
| OutputFilePath | remoteFile | In & Out | Specifies the file path of output file when OutputFile is set to "true". | ||||||
| OutputHome | pathResolver | - |
Specifies the base folder of relative path of output file when OutputFile is set to "truequot;.
|
||||||
| Template | string | - | Specifies template directly when TemplateType is set to "Inline". | ||||||
| TemplatePath | remoteFile | - | Specifies the file path of template when TemplateType is set to "File". | ||||||
| TemplateHome | pathResolver | - |
Specifies the base folder of relative path of template file when TemplateType is "File".
|
||||||
| TemplateEncoding | choice | - | Specifies the encoding of template file when TemplateType is "File". | ||||||
| Details | string | - |
Specifies the details. When clicking the field, the dialog box is displayed. In the dialog box, you can preview a chart by input test data. |
||||||
| Default Colors | string | In & Out |
Specifies colors or patterns to use in a chart. 36 of deefault colors are defined. These are used periodically. When clicking the field, the "Select default colors" dialog is displayed. Click the color, edit it, click the "Set" button, then the color is changed. |
||||||
| Param | category | In & Out |
Specifies the parameters of chart. When replacing the other chart component to this, the properties of previous component are set. |
Transaction
| Commit | Do nothing |
|---|---|
| Rollback | Do nothing |
Exceptions
| Type | Parameter | Stream for error handling flow | Error Code | Description |
|---|---|---|---|---|
| Exception | None | This component's input stream | - | When failed to generate a chart |
| - | When OutputFilePath is not specified if OutputFile is set to "true" | |||
| RecordNotFoundException | None | This component's input stream | 2 | When no record is input |
Stream variable AreaTags
When the value is set to Title, HREF, and Target field by the input stream definition, the area tag of clickable map information when the chart is referred by a web browser is set to stream variable AreaTags.
If img and map are used together with the area tag in HTML that uses Velocity to refer to the chart by a web browser, the generated chart becomes a clickable map.
By setting the values of Title, HREF, and Target of the input stream definition to the data element of the template to create chart, the area tag will be output.
It comes to be able to execute JavaScript by the event handler of the clickable map by describing the another of Title, HREF, and Target and following attributes in the data element of the template inside.
- href
- target
- title
- onclick
- ondblclick
- onkeydown
- onkeypress
- onkeyup
- onmousedown
- onmousemove
- onmouseout
- onmouseover
- onmouseup
Template Format
The XML data for generating by XMLGraph in BFO is based on the template.
This component creates the XML data to generate chart by using a template as follows.
- Sets the input stream and parameters to XML data using Velocity.
- Sets the attributes, which is defined in "GraphEditor", to XML data.
Using Velocity
The Velocity object that can be used in the template is as follows.
Stream($in)
This is an object of input stream.
It can access each record in the stream by using the record method.
For details, please refer to Stream object of Velocity component.
In Velocity component, $in is an array of stream. But, in Graph component, it becomes to a stream object because only one stream can be accepted.
Variables($flow, $exvar, $system)
As well as the Velocity component, various variables defined in flow can be referred to.
For details, please refer to Variables of Velocity component.
System($sys)
As well as the Velocity component, the system functions can be used.
For details, please refer to System functions of Velocity component.
Parameters($param)
Parameter properties of the component.
| Method Name | Arguments | Return Value | Description |
|---|---|---|---|
| get() | String | Value | Gets the value by specifying parameter name. |
| getString() | String, String | String | Gets the value by specifying parameter name as the fisrt argument. For the second argument, you can specify the default value when the parameter is missing. |
| getDecimal() | String, BigDecimal | BigDecimal | Gets the value by specifying parameter name as the fisrt argument. For the second argument, you can specify the default value when the parameter is missing. |
| exists() | String | boolean | Gets whether the value is set to the parameter specifying the parameter name. |
Utility($util)
Utility functions only for the Graph component.
Using these utility functions, it is possible to calculate of the total, or to calculate the ratio of the values calculated as others.
| Method Name | Arguments | Return Value | Description |
|---|---|---|---|
| formatDate() | Date | String | Formats the value of java.util.Date to "YYYY-MM-DD" form. |
| formatValue() | Value | String | Checks the Value type and formats it to "YYYY-MM-DD" form when DateTime type. Otherwise, outputs the string as is. |
| getZERO() | なし | BigDecimal | Returns 0 of BigDecimal |
| sum() | String | BigDecimal | Returns the total of all of field records specified. |
| max() | BigDecimal, String | BigDecimal | Returns the maximum value of the values specified by the first and second arguments. |
| calcRaidus() | BigDecimal, BigDecimal, BigDecimal | BigDecimal | Arg 1 - Maximum of axis X Arg 2 - Maximum of axis Y Arg 3 - Value width of axis X Returns the size (height) in the axis Y calculated from the size in axis X so that the bubble may become circle in the bubble chart. |
| sumOther() | String, double | BigDecimal | Returns the total of values of the field specified by the first argument, which is less than the ratio specified by the second argument. (This is used for calculating the total of "Others" from "OtherPercent" in Pie or Bar chart.) |
| percentage() | BigDecimal, BigDecimal | double | Returns the ratio of the value specified by the second argument in the total specified by the first argument. Returns the value as a percentage of two decimal point digits. |
| distinct() | String | List<String> | Returns the list of values that is not duplicated. This is used for getting the kinds of the bar in the stacked bar chart or multi bar chart. |
| setGroup() | String, String | List<String> | Sets the group list by specifying the field name of the group and the value. The first argument is the field name of the group. The second argument is the field name of the value. It returns the list of non-duplicated field names. |
| isOther() | String, double | boolean | Returns if the ratio of total value of the group specified by the first argument is less than the value specified by the second argument. The group must be set by setGroup(). This is used for deciding the group is in "Others" group in the stacked bar chart or multi bar chart. This method becomes error when setGroup() is not called. |
| getDefaultColor() | int | String | Returns the name of color defined in Colors property. The 0-based index is specified by the argument. When indices are larger than the defined numbers of colors, it returns to the head and the same color is used again. Thus, positive value does not cause an error. |
| getRecordColor() | String, String | String | Returns the value of "Color" field of the first record where the field value specified by the first argument is same as the field value specified by the second argument. Input record must have a field named as "Color". When matched record is not found or when "Color" field is not found, returns empty string. |
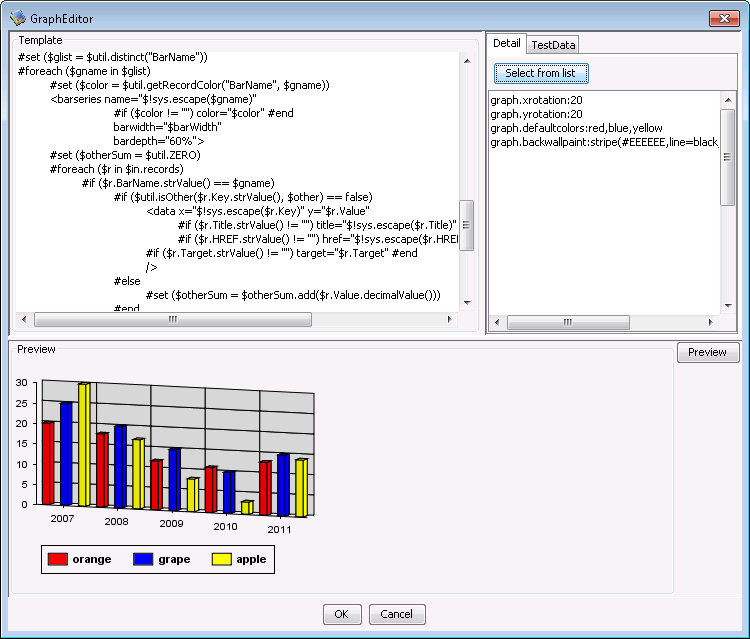
Using "GraphEditor"
You can configure the chart setting to change the chart color or to display 3D by GraphEditor.
You can also preview chart using test data.
Displays "GraphEditor" by following operation.
- Click the field of Detail
- Click the "Edit graph settings" from right click menu of Graph component.
"a:id" attribute is an original extention of XML in this component.
It is possible to configure details of the chart using "a:id" inn the tab "Details" of "GraphEditor". You can define multiple settings separated by line feed.
<ID>.<Attribute Name>:Value
ID appears as an attribute a:id in the template. When there is no a:id attribute, the element name becomes ID.
The setting often used can be easily set by choosing from the list displayed clicking "Select from list" button.
Please refer to BFO Tag List or Sample what attribute each element for you can use.
Test Data
Specifies the test data in CSV format.
By inputting the test data and clicking the "Preview" button, you can preview the chart.
Using of template and detailed setting properly
Even when either is used, the output result becomes the same. It is easy to change the value selected with "Select from list" button of a detailed setting the change of the template among. It is possible to do only by changing the template at the change that adds the element.
When TemplateType is set to "File", the template is downloaded from the server and it's displayed. After the template is modified, it can be uploaded when closing it.
When the file doesn't exist, almost functions cannot be used because the template cannot be read. Since the template file is read when the component is initialized, it cannot be replaced in the flow.