 LineGraph - Generates a line chart (PNG)
Generates a line chart image of the PNG format based on input data.
For the flow example that uses this component, please refer to "Example of flow using various chart components".
This component uses BFO library.
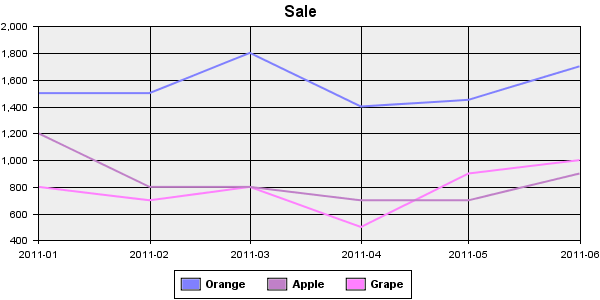
Chart sample
Stream Information
| Input | Format | Record |
|---|---|---|
| Number of Inputs | 1 | |
| Description | Field is pre-defined for this chart. This is read-only. For definitions, please refer to following topic "Input stream definition". | |
| Output | Format | Binary |
| Description | Outputs the chart image of the PNG format. |
Output Stream Variables
| Name | Data Type | Description |
|---|---|---|
| AreaTags | String | Don't output from this component. |
Component Properties
| Name | Data Type | Mapping | Description | |||||||||||||||
|---|---|---|---|---|---|---|---|---|---|---|---|---|---|---|---|---|---|---|
| Width | int | In & Out | Specifies the width of chart image by pixel. | |||||||||||||||
| Height | int | In & Out | Specifies the height of chart image by pixel. | |||||||||||||||
| Title | string | In & Out | Specifies the label of top of the chart. | |||||||||||||||
| Key | choice | In & Out |
Specifies the position to display item names.
|
|||||||||||||||
| LabelFormat | choice | In & Out |
Specifies the date format of axis X.
|
|||||||||||||||
| 3D | boolean | In & Out |
Specifies if enables chart 3D.
|
|||||||||||||||
| LabelRotate | int | In & Out |
Specifies the inclination of the label of the chart. If specifies "-20", The label becomes a right shoulder going up. To display the label vertically, specifies like "90" or "-90" |
|||||||||||||||
| AxisSetting | group | - | Properties for specifies axis information. | |||||||||||||||
| LeftMin | int | In & Out | Specifies minimum of axis Y. | |||||||||||||||
| LeftMax | int | In & Out | Specifies maximum of axis Y. | |||||||||||||||
| LeftLabel | string | In & Out | Specifies label of axis Y. | |||||||||||||||
| BottomLabel | string | In & Out | Specifies label of axis X. | |||||||||||||||
| BackwallPaint | choice | In & Out |
Specifies a background of the chart.
|
|||||||||||||||
| Standard Colors | string | In & Out |
Specifies colors or patterns to use in a chart. 36 of deefault colors are defined. These are used periodically. When clicking the field, the "Select default colors" dialog is displayed. Click the color, edit it, click the "Set" button, then the color is changed. |
Transaction
| Commit | Do nothing |
|---|---|
| Rollback | Do nothing |
Exceptions
| Type | Parameter | Stream for error handling flow | Error Code | Description |
|---|---|---|---|---|
| Exception | None | This component's input stream | - | When failed to generate a chart |
| RecordNotFoundException | None | This component's input stream | 2 | When no record is input |
Input stream definition
Input stream of this component is defined as follows.
| Field Name | Type | Required | Description |
|---|---|---|---|
| LineName | String | Yes | Line name. |
| Key | DateTime | Yes | Chart date. |
| Value | Decimal | Yes | Item value. |
| Color | String | No | Line color. If specified, use specified color instead of the color specified by Colors . |
Replacing component
This component can be replaced with the following components. Click "Replacing component" of the menu when right-clicking the compoent.
AreaGraph component
Generates an area chart. The input stream is the same. It can be replaced each other.
Graph component
If you want to customize a chart more, you can customize further details by replacing with Graph component.
You can customize chart more by modifying the template in Graph component.
For details, please refer to Graph component's help
After replacing with Graph component, you can not replace it with this component again.